
How can we help?
Profit and Loss Analysis Entry
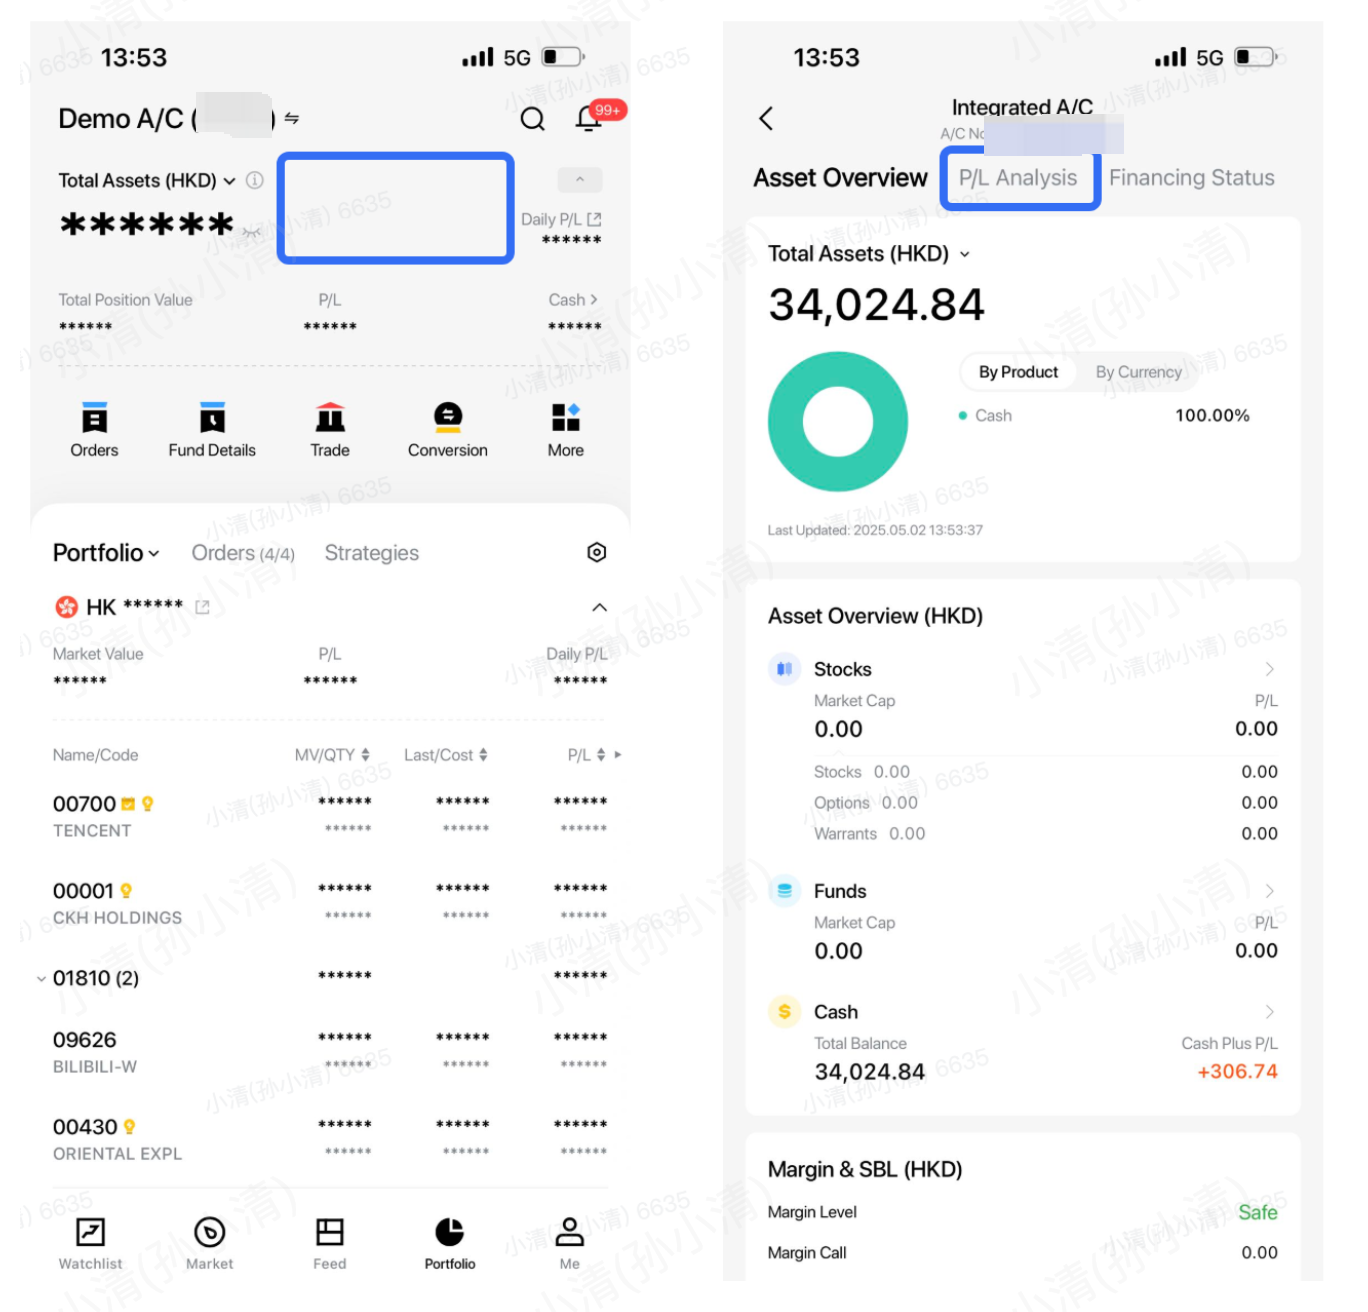
(1) Click on the blank area of the Asset Overview and select "Pr/L Analysis".
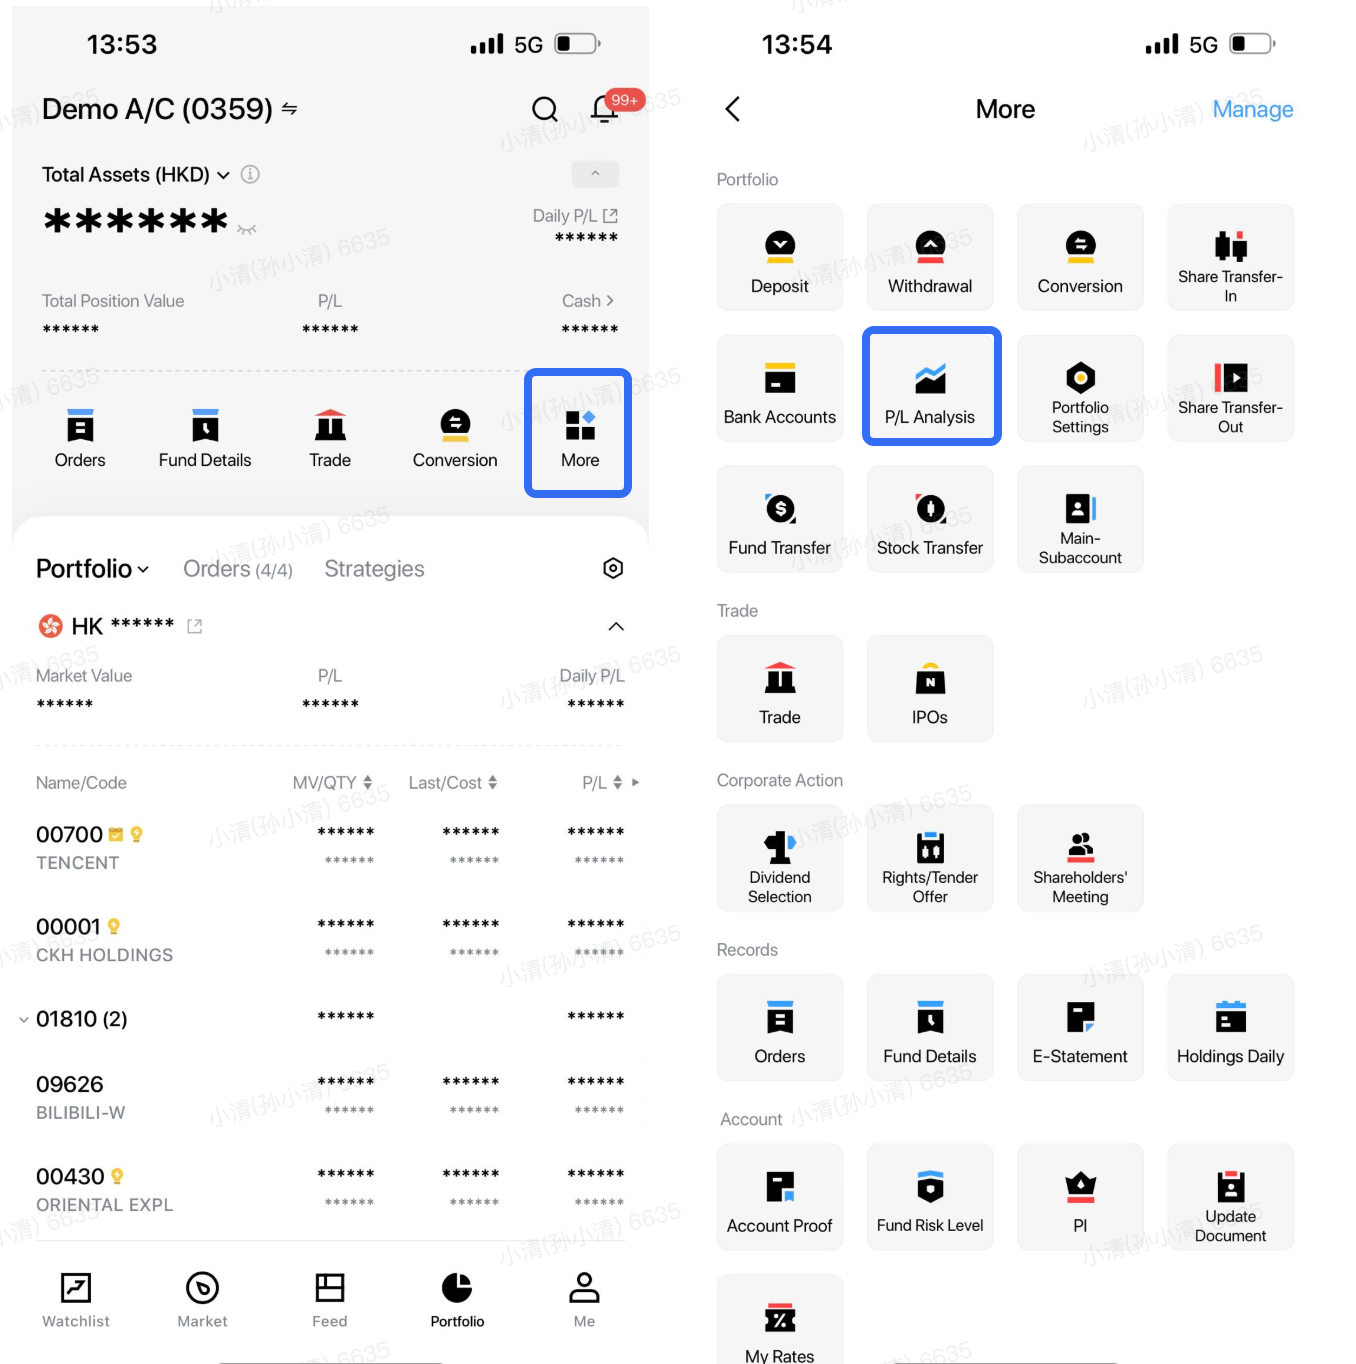
(2) Click on "Assets" - "More",select "Profit and Loss Analysis".
Profit and Loss Analysis Function Description
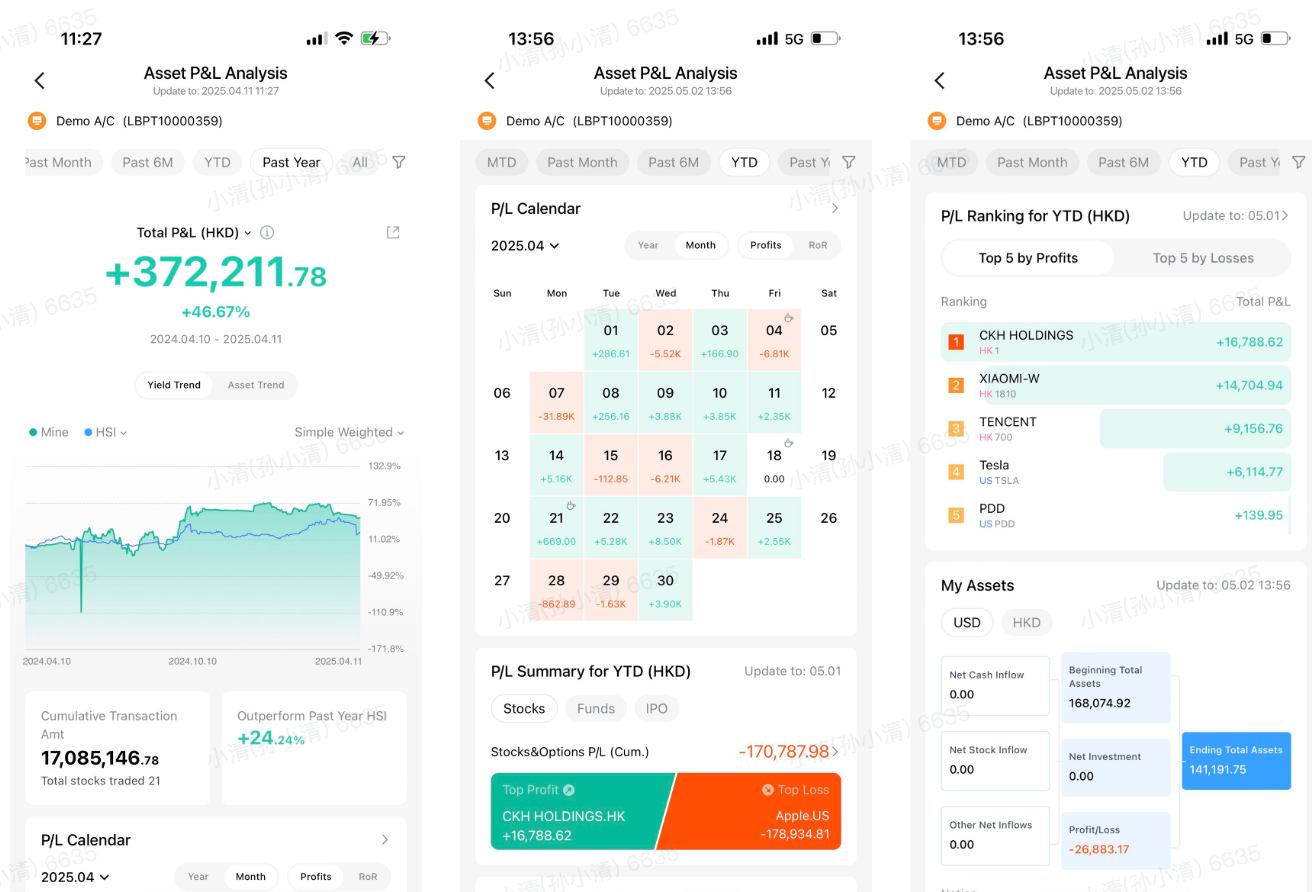
On the Profit and Loss Analysis page, you can review your earnings and fully analyze your trading profit and loss situation. The main features include: cumulative profit and loss amount, cumulative return rate, performance against market indices, daily profit details, individual stock profit details, and asset changes.
Explanation of Profit and Loss Related Fields
(1) Accumulated Profit and Loss
Accumulated profit and loss statistics refer to the total amount of profit and loss in the account caused by transactions or corporate actions, etc.
Accumulated profit and loss = total of daily profits and losses during the period, where daily profit and loss = U.S. dollar profit and loss * Hong Kong dollar exchange rate + Hong Kong dollar profit and loss.
Daily profit and loss = total assets at the end of the period - total assets at the beginning of the period - net investment during the period.
As Changqiao is an integrated account, when calculating profits and losses, it will be converted to Hong Kong dollars for calculation. Due to exchange rate fluctuations, the profit and loss amount may change even if there are no transactions;
Total assets at the end of the period (HKD equivalent) = Total U.S. dollar assets * End of period exchange rate + Total Hong Kong dollar assets * End of period exchange rate
Total assets at the beginning of the period (HKD equivalent) = Total U.S. dollar assets * Beginning of period exchange rate + Total Hong Kong dollar assets * Beginning of period exchange rate
Net investment during the period: The following business will be considered as investment and will not be recorded in profit and loss
- Deposits and withdrawals, transfers between master and sub-accounts
- Transfer of positions, transfer of positions between master and sub-accounts
- Currency exchange
- Interest on margin financing and securities lending
- Cash card rewards
(2) Daily Profit and Loss
Position Profit and Loss, also known as "floating profit and loss," records the total profit and loss from the time the position was opened until now, excluding any transaction fees.
- For a long position, Position Profit and Loss = (Current Price - Cost) * Current Quantity
- For a short position, Position Profit and Loss = (Cost - Current Price) * Current Quantity Cost: The current system supports two options for cost pricing, which are Diluted Cost and Average Opening Position Cost. The default is Diluted Cost. If you need to change it, you can make a selection in "Asset Homepage" - "All Functions" - "Asset Settings" - "Cost Calculation Method". For more detailed information, please refer to the Position Profit and Loss Explanation.
Cost: The current system supports two options for cost pricing, which are Diluted Cost and Average Opening Position Cost. The default is Diluted Cost. If you need to change it, you can make a selection in the "Asset" - "All Functions" - "Asset Settings" - "Cost Calculation Method". For more detailed information, you can refer to the explanation of Intraday P/L.
(3) Intraday P/L
Intraday P/L refers to the cumulative P/L from the previous trading day’s closing price to the current trading day’s session.
Calculation formula: Daily Profit and Loss = (Current Price * Current Holding Quantity) - (Yesterday's Closing Price * Yesterday's Closing Holding Quantity) + Today's Sales Transaction Amount - Today's Purchase Transaction Amount.
If any transactions/stock price changes occur, the daily profit and loss will be updated accordingly.
For Hong Kong stocks: The daily profit and loss is calculated based on the stock price changes and trading activities between 9:00 AM on day T to 9:00 AM on day T+1, according to Hong Kong time.
For U.S. stocks, the situation is a bit more complex due to the influence of pre-market and after-hours trading, as well as night trading.
1.Night trading mainly affects the latest price and the statistical time period range.
- If night trading is enabled, the statistics are from 8:00 PM on day T to 8:00 PM on day T+1, U.S. Eastern Time, and the latest price will include the prices during the night trading period.
- If night trading is disabled, the statistics are from 4:00 AM on day T to 4:00 AM on day T+1, U.S. Eastern Time, and the prices during the night trading period are not included in the calculation.
2.Pre-market and after-hours trading mainly affect the calculation of the latest price.
- If pre-market and after-hours trading are enabled, the latest price will include the prices during the pre-market and after-hours periods.
- If pre-market and after-hours trading are disabled, the prices during the pre-market and after-hours periods are not included in the calculation.
3.If both pre-market and after-hours trading and night trading are disabled: then only yesterday's closing price and the intraday price will be used. If there is a corporate action such as stock split or consolidation during the pre-market phase, it may result in the use of an outdated closing price, causing the asset display to continue to be calculated based on the closing price. In this case, enabling pre-market and after-hours prices will restore normalcy.
4.If pre-market and after-hours trading are enabled, but night trading is not: then the latest price will be the pre-market and after-hours price, and the price after the market closes will still be used during the night trading period.
5.The intraday P/L only calculates the actual holdings, excluding transaction-incurred fees such as handling fees.
For more detailed explanations, you can refer to the Intraday P/L.
(4)Cost Calculation
Cost: The current system supports two options for cost pricing, which are Diluted Cost and Average Price. The default is Diluted Cost, and if you need to change it, you can make a selection in "Asset" - "All Functions" - "Asset Settings" - "Cost Calculation".
4.1 Diluted Cost
The term "Diluted Cost" represents the break-even price during the period from opening to closing a position, meaning that during the time the position is held, each addition to or reduction of the position could either increase or decrease this cost price. The calculation includes the profit and loss of each transaction within the holding period (excluding commissions and other fees), taking into account both purchases and sales, as well as changes due to corporate actions such as dividends.
Calculation formula:
- For a long position, Diluted Cost = (Total amount bought during the holding period - Total amount sold during the holding period - Cash dividends received during the holding period) / Current holding quantity.
- For a short position, Diluted Cost = (Total amount sold during the holding period - Total amount bought during the holding period - Cash dividends received during the holding period) / Current holding quantity.
Cost update logic: The diluted cost is updated after every buy or sell transaction.
4.2 Average Price
The average opening position cost represents the cost corresponding to the held position, considering only the addition to the position (excluding commissions and other fees), and does not account for the reduction of the position. The reduced position has already been converted into realized profit and loss.
Calculation formula: Average opening position cost = (Average cost before opening * Quantity before opening + Amount of this opening) / Quantity held after purchase
Cost update logic: After a successful opening transaction (long position opened by buying, short position opened by selling), the opening cost will be updated. However, the average opening position cost is not updated upon liquidation/establishment of a position.
4.3 Unified Cost Calculation Rules
Unified cost calculation rules apply to both the diluted cost and the aaverage price:
- If there is a transaction in the same direction within the same day, such as clearing and rebuilding a long position within the same day, the system will treat it as a 'T' transaction and continue to calculate the cost based on the data during the holding period.
- However, if it is a transaction in a different direction, such as short selling - closing the position - buying long within the same day, the cost will be cleared after clearing the position, and the calculation will start anew upon rebuilding the position.
- For more detailed information, please refer to the Cost Calculation.
Yield Calculation Methods
Currently, there are two calculation rules for yield:
(1) Simple Weighted Return = Cumulative Yield = Cumulative Return / (Initial Total Assets + Net Inflows during the Period)
This method treats all net inflows, such as fund deposits and withdrawals, and stock transfers within the statistical period as occurring at the end of the period, and then adjusts them to the initial assets, combining them with the initial assets as the input cost.
- Advantages: Quick calculation, simple and easy to understand
- Disadvantages: Compared to the other two methods, it is relatively inaccurate, especially when there are large withdrawals or the calculation period is long, which may distort and exaggerate the yield, even resulting in negative values, thus losing its reference value.
(2) Time-Weighted Return = [ 1 * (1 + Daily Return on Day 1) * (1 + Daily Return on Day 2) ... * (1 + Daily Return on Day n) - 1 ] * 100%
Where Daily Return = Daily Profit or Loss / (End-of-Day Assets of the Previous Day + Net Inflows of the Day)
Net inflows refer to fund deposits, withdrawals, and stock transfers. This method divides the entire period into daily segments, calculates the daily yield first, and finally calculates the cumulative yield for the period.
- Advantages: Dividing the period into multiple time segments minimizes the impact of net inflows on the yield.
- Disadvantages: It does not consider the amount of investment and treats daily yields equally. If there are frequent and large (relative to the account's net value) fund deposits and withdrawals, it may result in the yield amount and yield rate having opposite signs, making the yield rate meaningless.
Profit and Loss Calendar
The Profit and Loss Calendar calculates profits and losses by currency type and then totals them, thus it is not affected by exchange rate fluctuations and reflects the actual profit and loss situation.
Firstly, the profit and loss for each currency type is calculated, then summed up and converted into Hong Kong dollars.
Profit and Loss of Currency A = Total Assets at the end of Period T - Total Assets at the beginning of Period T-1 - Net investment on the current day
Daily Profit and Loss = Profit and Loss of Currency A * Exchange Rate of Currency A + ... + Profit and Loss of Currency N * Exchange Rate of Currency N
Note: The profit and loss displayed on the Profit and Loss Calendar is not the same as the daily profit and loss on the Assets page for the following reasons:
- The profit and loss in the earnings calendar is calculated by subtracting the total assets at the beginning of the day from the real-time assets of the day. Total assets at the beginning of the day = combined cash at 20:00 EST + combined market value of holdings (this calculation only uses the closing prices of US and Hong Kong stocks)
- 20:00 EST corresponds to 08:00 in Beijing time during daylight saving time and 09:00 during standard time.
- Daily profit and loss = (current price * current quantity) - (yesterday's closing price * yesterday's closing quantity) + today's sell transaction amount - today's buy transaction amount; Separately by market, the daily profit and loss = today's Hong Kong stock profit and loss + yesterday's US stock profit and loss + fund profit and loss.
- Among them, the US stock profit and loss will be automatically adjusted according to the pre-market and after-market prices enabled by the customer. For detailed logic, please refer to the Intraday P/L.
Common Profit and Loss Issues
After Ex-Dividend Date, Stock Incurs a Loss
After the ex-dividend date, the total market value of the current position actually decreases according to the latest price, but the dividend is paid out after the ex-dividend date. In this case, the cost will only decrease after the dividend is credited to the account.
Discrepancy Between Holding Profit and Loss and Daily Profit and Loss
Holding profit and loss is calculated cumulatively from the opening of a position and is related to the cost price.
Daily profit and loss represents the difference in the stock's market value on the current day compared to the previous day's market value, and it is related to the stock's closing price from the previous day.
After Selling Stocks and Then Short Selling, the Client Feels the Cost and Profit and Loss Do Not Match Up
After changing the position direction, the profit and loss will be recalculated, as if the previous position direction has been closed, and it will not inherit the long position's cost.
Discrepancy Between Profit and Loss Ranking and Individual Stock Profit and Loss Accumulation
The update frequency of the statistics on both sides is different, which can lead to discrepancies: The profit and loss ranking is offline data, updated once a day; whereas the details of individual stock profit and loss are real-time data, updated in real time.
Total Profit and Loss Is Not Equal to the End of Period Total Assets - Beginning of Period Total Assets
Since it is an integrated account, the assets at the beginning and end of the period will be converted to Hong Kong dollars for calculation, but the profit and loss amount does not consider changes in exchange rates. For example:
A deposit of 10,000 USD was made, with an initial exchange rate of 7.8, resulting in an initial asset value of 78,000 HKD after conversion. With no transactions made, the end of period assets remain at 10,000 USD, but with an end of period exchange rate of 7.82, the assets are converted to 78,200 HKD. However, the actual profit and loss is zero.
The profit and loss displayed on the Profit and Loss Calendar is not the same as the daily profit and loss on the Assets page
The reasons are as follows:
- The profit and loss in the earnings calendar is calculated by subtracting the total assets at the beginning of the day from the real-time assets of the day. Total assets at the beginning of the day = combined cash at 20:00 EST + combined market value of holdings (this calculation only uses the closing prices of US and Hong Kong stocks)
- 20:00 EST corresponds to 08:00 in Beijing time during daylight saving time and 09:00 during standard time.
- Daily profit and loss = (current price * current quantity) - (yesterday's closing price * yesterday's closing quantity) + today's sell transaction amount - today's buy transaction amount; Separately by market, the daily profit and loss = today's Hong Kong stock profit and loss + yesterday's US stock profit and loss + fund profit and loss.
- Among them, the US stock profit and loss will be automatically adjusted according to the pre-market and after-market prices enabled by the customer. For detailed logic, please refer to the Intraday P/L.
- Contact Us
- WhatsApp Chat (for general enquiries):+65 6330 3033
- Trading days: 9:00am – 6:00pm (GMT+8)
- Dealing Hotline:+65 6330 3030
- Trading days: 9:00am – 6:00pm (GMT+8)
- For Institutions
- Corporate Services
- OpenAPI
- contact@longbridge.sg
- About
- About us

Registered with the Monetary Authority of Singapore (MAS), Long Bridge Securities Pte. Ltd. is a Capital Markets Services Licence holder and Exempt Financial Adviser (Licence No. CMS101211).

A licensed corporation recognized by the SFC (CE No. BPX066). Holder of License Types 1 (Dealing in Securities), 4 (Advising on Securities) and 9 (Asset Management). Also a registered HKEX participant and HKSCC participant.
 Long Bridge Securities LLC
A broker dealer registered with the Securities and Exchange Commission (SEC)(CRD: 314519/SEC: 8-70711), a member of the Financial Industry Regulatory Authority (FINRA) and Securities Investor Protection Corporation (SIPC).

A New Zealand registered Financial Service Provider (FSP number: FSP600050), and is a member of the Financial Dispute Resolution Scheme, a New Zealand independent dispute resolution service provider.
Long Bridge Securities Pte. Ltd. (“Long Bridge Securities”) (UEN No.: 202111825D) is regulated by the Monetary Authority of Singapore and holds a Capital Markets Services Licence for dealing in capital markets products that are securities, collective investment schemes, and exchange-traded derivatives contracts, and is an Exempt Financial Adviser.
The information contained on this website is provided for general information and educational purposes only. It does not take into account your specific investment objectives, financial situation, or particular needs. The content on this website does not constitute financial advice, an investment recommendation, an offer, or a solicitation to buy or sell any financial product.
You should carefully consider the suitability of any investment in light of your own circumstances, including your investment objectives, financial situation, and risk tolerance. Where necessary, you should seek advice from an independent financial adviser under a separate engagement before making any investment decision.
All investments carry risks. The value of financial instruments and products may rise or fall, and you may lose all or more than your initial investment. Past performance is not necessarily indicative of future results. Certain products, such as margin trading, options, warrants, exchange-traded derivatives, and structured products, involve a high degree of risk and may not be suitable for you.
Before trading, you must read the relevant risk disclosure statements available on the Longbridge Risk Disclosure Statement page.
While Long Bridge Securities takes reasonable care to ensure that the information provided on this website is accurate as at the time of publication, no representation or warranty is made as to its accuracy, adequacy, completeness, or reliability. Information may be subject to change without notice. Long Bridge Securities shall not be liable for any loss or damage arising from any reliance on or use of the information contained on this website.
This advertisement has not been reviewed by the Monetary Authority of Singapore.
In the event of any discrepancy or inconsistency between the English version and the Chinese translation, the English version shall prevail.