
1.What's "cost distribution"?
The "cost distribution" refers to the distribution of the holding cost of circulating stocks, reflecting the number of shares held by investors at different prices. Observing the distribution of chips on each trading day can provide a complete understanding of the trading status of circulating stocks, thereby further assessing stock price trends. Firstly, the distribution of costs can be used to determine whether the trend continues. In an upward trend, if the chip(cost) moves up with the increasing price, and the stock price is at or slightly above the average cost, it indicates that bullish sentiment is spreading, and there are constantly investors willing to take orders of sold stocks. The upward trend is expected to continue, and the downward trend is the same. Furthermore, the future operating trend of stock prices can be judged based on the degree of chip density above and below the price. If there is a large amount of chip density above the current stock price, it is highly likely to encounter a sell-off of the previously held market during the process of stock price rise, making it difficult for the stock price to rise. To break through this resistance, it is necessary to have a large trading volume in conjunction with the uptrend. On the contrary, if a large amount of chips are mainly concentrated below the current stock price, the resistance during the pull-up process is relatively small and the stock price is more likely to rise.
2.How to view the chip distribution map?
Click on the chip distribution entry in the upper right corner to display the distribution of chips on the last trading day by default. Move the K-line to view the distribution of chips on different trading days.
3.Explanation of various indicators of chip distribution (taking red rise and green fall as an example)
interpretative statement
The red chip area represents profit making chips, and the holding cost of these chips is lower than the current price;
The green chip area represents loss-making chips, and the holding cost of these chips is higher than the current price;
The yellow line represents the average cost of all chips;
Pressure level refers to the position where resistance is easily encountered during the rise of stock prices;
Support level refers to the position where support is easily obtained during the process of stock price decline;
4.Tips for using chip distribution
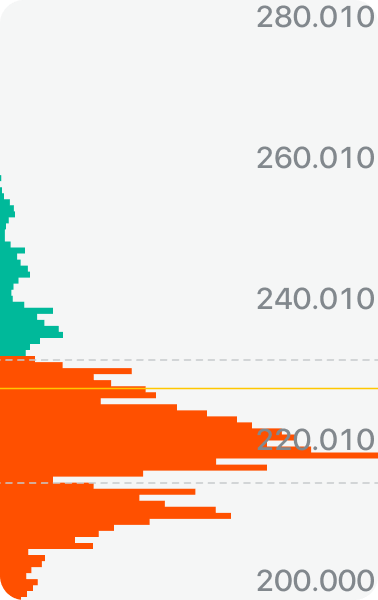
(1) Density at a low price
This pattern occurs after a continuous decline or low level sideways movement in stock prices, when the high chips shift to the low ones. If these low chips are concentrated in a smaller price range and the proportion of profit chips is large, a low dense pattern is formed. At this point, the resistance to stock price rises decreases, and a bottom is likely to occur, which is an organic wave of rise.
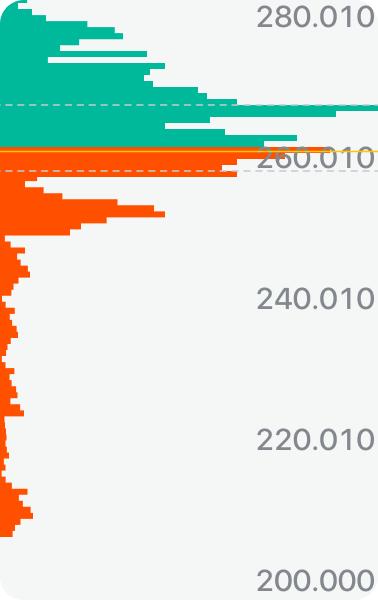
(2) Density at a high price
This pattern occurs after the stock price continues to rise or fluctuates horizontally, at which point the low chips transfer to the high ones. If these high chips are concentrated in a smaller price range and the proportion of profit chips is small, forming a high dense pattern, the resistance to stock price rises is relatively high. If the stock price continues to rise, it will encounter resistance to hold up and sell off, and the operation should mainly be avoided.
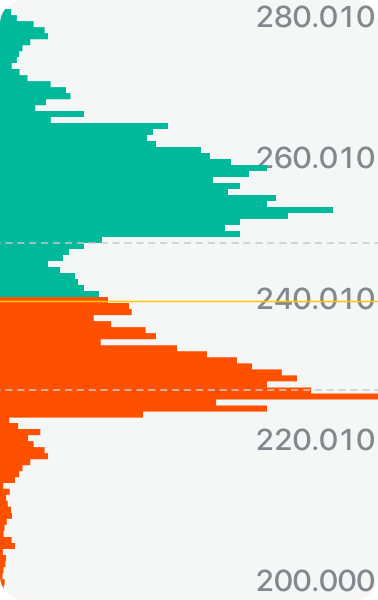
(3) Bimodal morphology
It refers to the formation of two dense peaks in the chip distribution map, where the stock price is sandwiched between these two dense areas. When the stock price goes down, it meets the support of the lower dense area, while when the stock price goes up, it meets the selling resistance of the upper dense area. At this time, the stock price is mostly characterized by volatility.
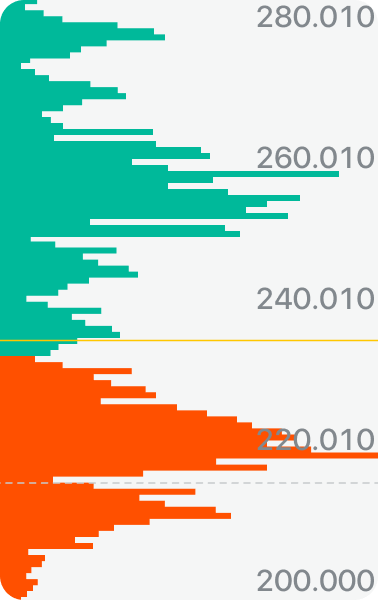
(4) Chip divergence
Chip divergence refers to the extreme dispersion of the corresponding price points of chips, indicating that the current chips are very dispersed and have not been controlled by manipulative individuals, forming market forces, and making it difficult for stock prices to experience explosive increases. This form is common in large cap stocks.
- Contact Us
- WhatsApp Chat (for general enquiries):+65 6330 3035
- Trading days: 9:00am – 6:00pm (GMT+8)
- Dealing Hotline:+65 6330 3030
- Trading days: 9:00am – 6:00pm (GMT+8)
- For Institutions
- Corporate Services
- OpenAPI
- contact@longbridge.sg
- About
- About us

Registered with the Monetary Authority of Singapore (MAS), Long Bridge Securities Pte. Ltd. is a Capital Markets Services Licence holder and Exempt Financial Adviser (Licence No. CMS101211).

A licensed corporation recognized by the SFC (CE No. BPX066). Holder of License Types 1 (Dealing in Securities), 2 (Dealing in Futures Contracts), 4 (Advising on Securities) and 9 (Asset Management). Also a registered HKEX participant and HKSCC participant.
 Long Bridge Securities LLC
A broker dealer registered with the Securities and Exchange Commission (SEC)(CRD: 314519/SEC: 8-70711), a member of the Financial Industry Regulatory Authority (FINRA) and Securities Investor Protection Corporation (SIPC).

A New Zealand registered Financial Service Provider (FSP number: FSP600050), and is a member of the Financial Dispute Resolution Scheme, a New Zealand independent dispute resolution service provider.
Long Bridge Securities Pte. Ltd. (“Long Bridge Securities”) (UEN No.: 202111825D) is regulated by the Monetary Authority of Singapore and holds a Capital Markets Services Licence for dealing in capital markets products that are securities, collective investment schemes, and exchange-traded derivatives contracts, and is an Exempt Financial Adviser.
The information contained on this website is provided for general information and educational purposes only. It does not take into account your specific investment objectives, financial situation, or particular needs. The content on this website does not constitute financial advice, an investment recommendation, an offer, or a solicitation to buy or sell any financial product.
You should carefully consider the suitability of any investment in light of your own circumstances, including your investment objectives, financial situation, and risk tolerance. Where necessary, you should seek advice from an independent financial adviser under a separate engagement before making any investment decision.
All investments carry risks. The value of financial instruments and products may rise or fall, and you may lose all or more than your initial investment. Past performance is not necessarily indicative of future results. Certain products, such as margin trading, options, warrants, exchange-traded derivatives, and structured products, involve a high degree of risk and may not be suitable for you.
Before trading, you must read the relevant risk disclosure statements available on the Longbridge Risk Disclosure Statement page.
While Long Bridge Securities takes reasonable care to ensure that the information provided on this website is accurate as at the time of publication, no representation or warranty is made as to its accuracy, adequacy, completeness, or reliability. Information may be subject to change without notice. Long Bridge Securities shall not be liable for any loss or damage arising from any reliance on or use of the information contained on this website.
This advertisement has not been reviewed by the Monetary Authority of Singapore.
In the event of any discrepancy or inconsistency between the English version and the Chinese translation, the English version shall prevail.