
How can we help?
This article will introduce in detail the profit and loss analysis function of Longbridge Securities, which can help users fully understand the investment income situation, including core indicators such as accumulated profit and loss, stocks & positions profit and loss, daily profit and loss and rate of return calculation, and support multi-dimensional trading review and asset change tracking.
1. Profit and loss analysis entry
(1) Click the blank space in Total Asset and choose P/L Analysis.
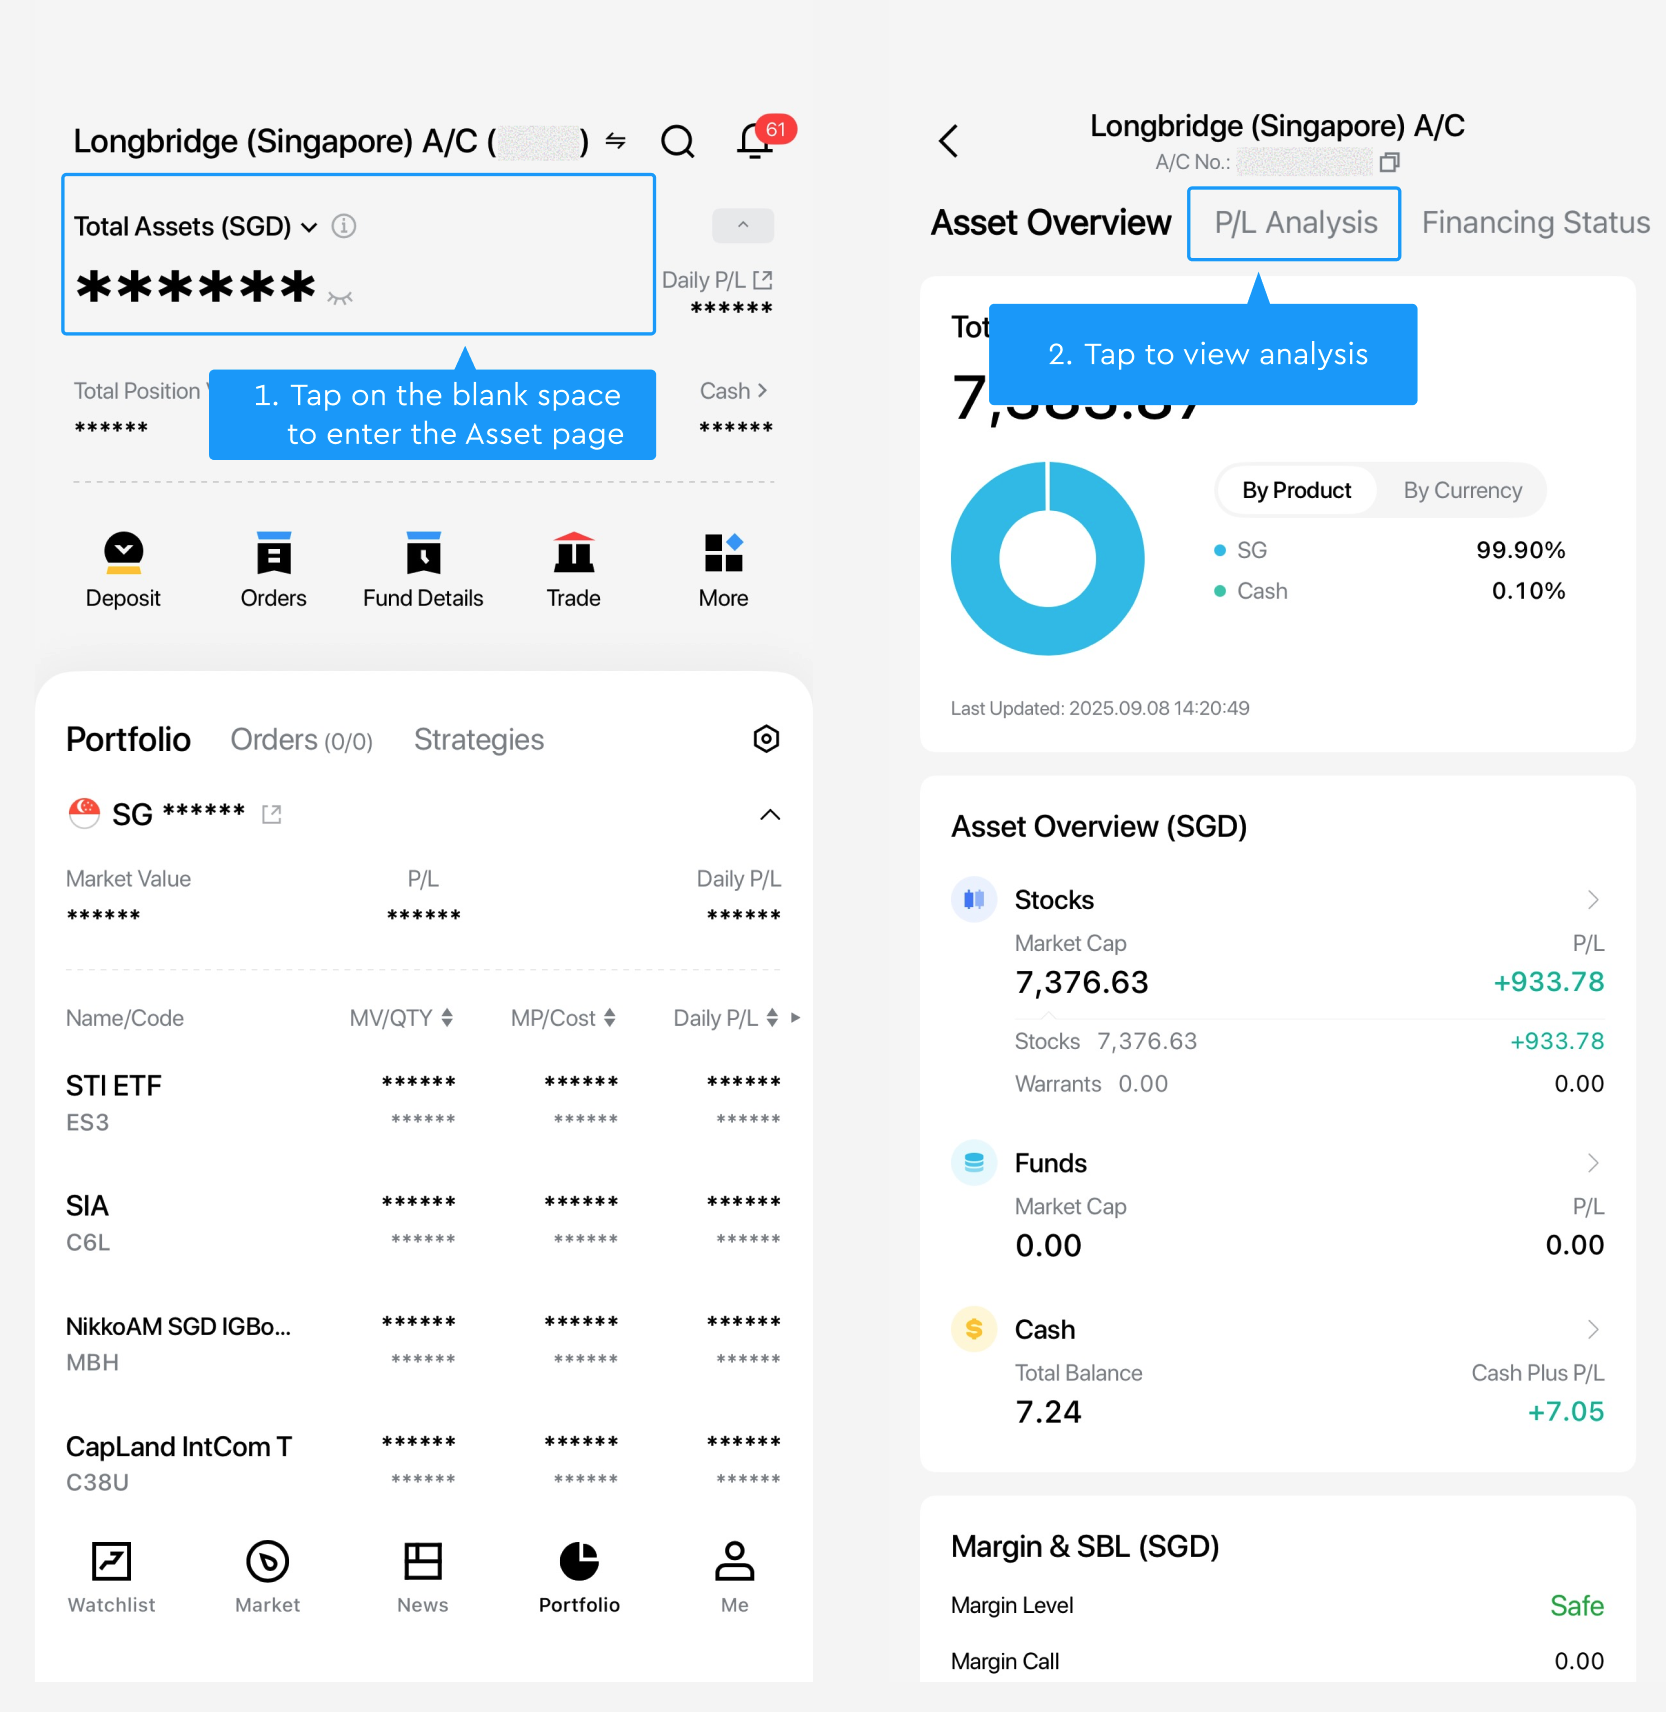
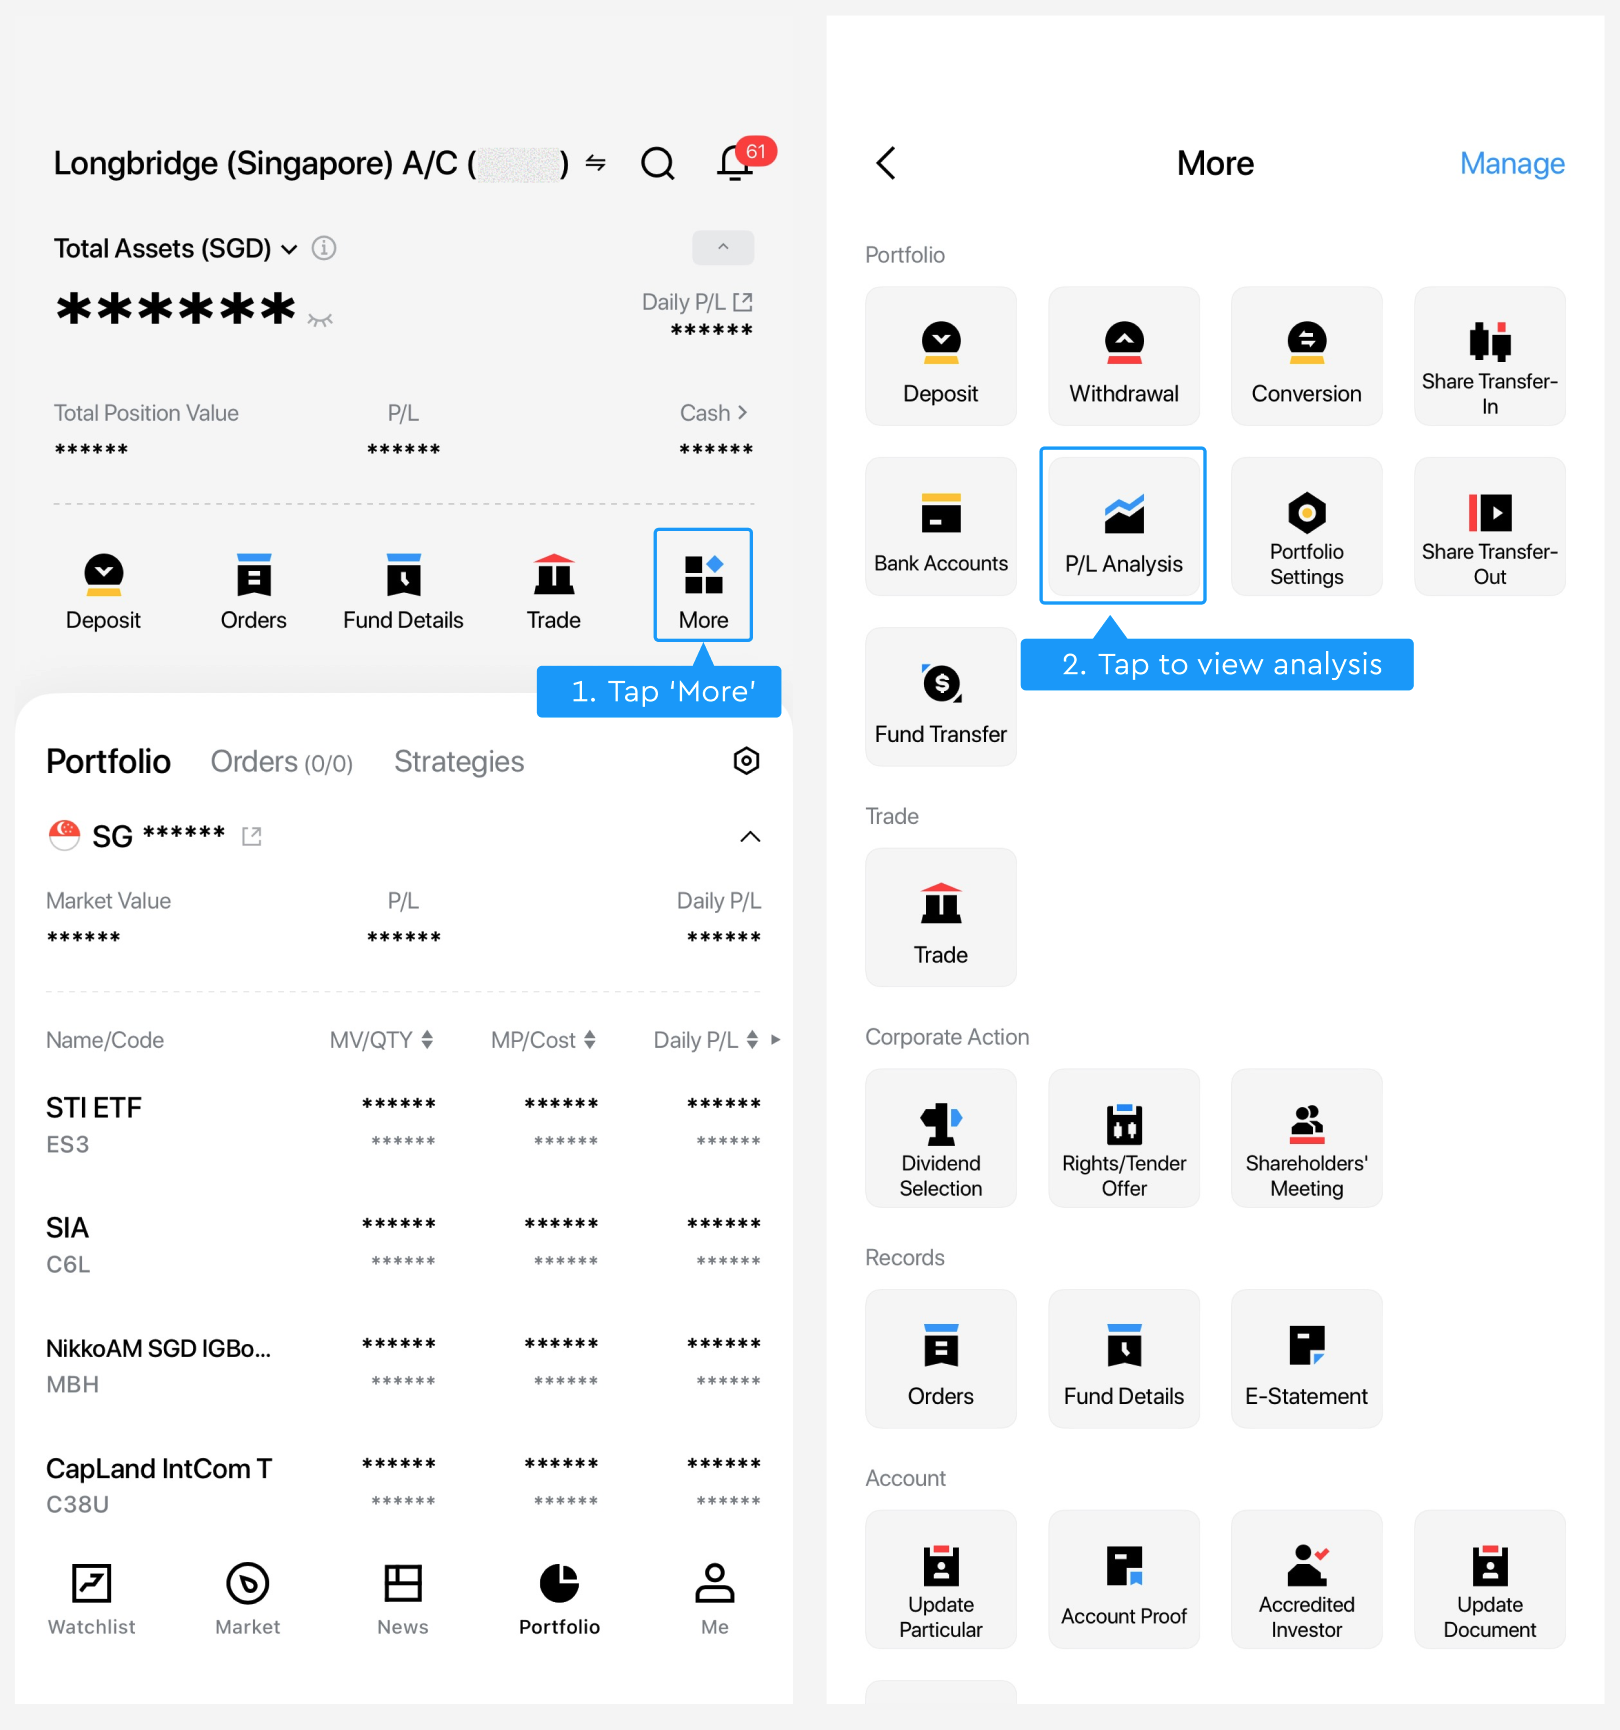
(2) Click Portfolio > More and select P/L Analysis.
2. Description of the P/L Analysis Function
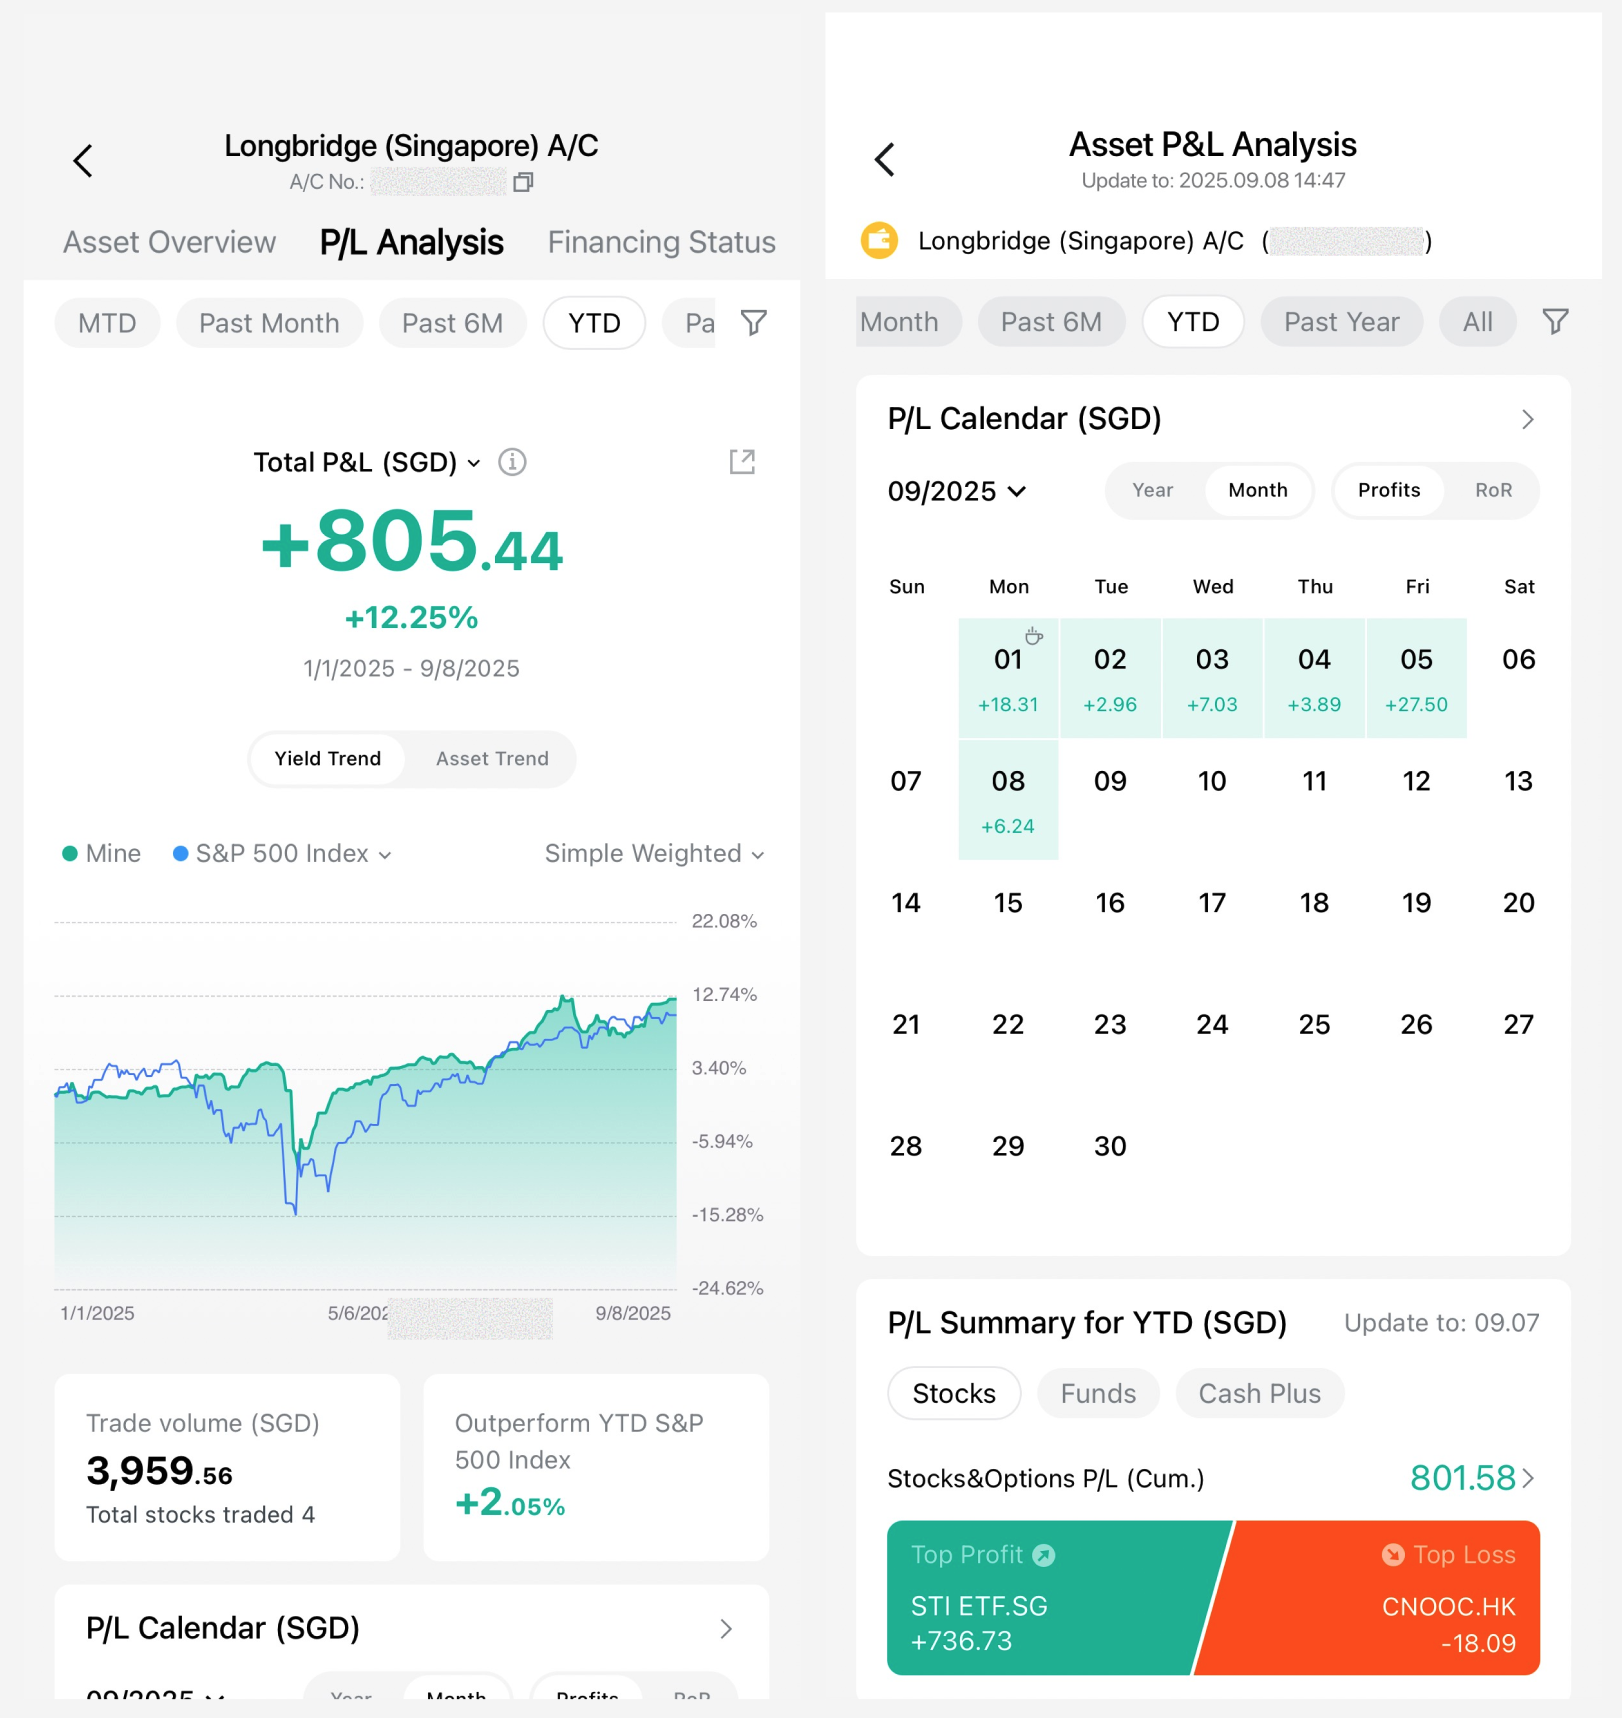
On the P/L Analysis page, you can view the income situation and comprehensively review the profit and loss of trading. The main functions include accumulated profit and loss amount, accumulated rate of return, outperformance of the market index, daily income details, individual stock income details, and asset changes.
3. Description of profit and loss related fields
Accumulated P/L
Accumulated P/L statistics are the total amount of account profits and losses caused by trading or corporate actions.
Accumulated P/L = Total daily profit and loss during the period, where Daily profit and loss = USD profit and loss × SGD exchange rate + SGD profit and loss
Daily P/L = Total assets at the end of the period - Total assets at the beginning of the period - Net investment during the period
Since Longbridge is an integrated account, when calculating profit and loss, it will be converted into SGD for calculation. Due to exchange rate fluctuations, the amount of profit and loss will also change without any trading.
- Total assets at the end of the period (SGD equivalent) = Total assets in USD × Ending exchange rate + Total assets in SGD × Ending exchange rate
- Total assets at the beginning of the period (SGD equivalent) = Total assets in USD × Opening exchange rate + Total assets in SGD × Opening exchange rate
- Net investment during the period: The following businesses will be regarded as investments and are not recorded in profit and loss
- Deposit and withdrawal, transfer between main and sub-account
- Switch, main and sub-account switch
- Currency exchange
- Margin trading and short selling interests
- Cash card rewards
Holdings P/L
Holdings P/L is also a floating profit and loss, which records the total profit and loss from the opening of the position to the present (excluding trading service fees)
Holdings P/L (long position) = (Current price - Cost) × Current quantity
Holdings P/L (short position) = (Cost - Current price) × Current quantity
Cost: Currently, the system supports two cost price options, namely diluted cost and average opening cost. The default is diluted cost. If you need to change it, you can select it in Portfolio > More > Portfolio Settings > Cost Calculation. For more details, please refer to P/L statement. Calculation of P/L & cost.
Daily P/L
Daily P/L means the accumulated profit and loss from the closing price of the previous trading day to the current trading day period.
**Calculation equation: **Daily P/L = Latest price × Current position quantity - Yesterday's closing price × Yesterday's closing position quantity + Selling turnover of the day - Buying turnover of the day. If there are changes in trading / stock prices, the daily profit and loss will be updated
1. SG stocks: Calculate the daily profit and loss based on stock price changes and trading behavior between 9:00 on T and 9:00 on T+1, SG time
2. The US stock market will be affected by pre-market, after-hours and overnight trading factors, and the situation will be a little more complicated.
a) Among them, the overnight trading mainly affects the latest price and statistical time period range
- **Open overnight trading, **Statistics from 20:00 on T to 20:00 on T+1 (ET). The latest price will take into account the price during the overnight trading period
- **Close overnight trading, **Statistics from 4:00 on T to 4:00 on T+1 (ET). Prices during the overnight trading period are not included in the calculation
b) The calculation of the latest price is mainly affected by pre-market and after-market.
- **Opening pre-market and after-hours, ** the latest price will take into account the prices in the pre-market and after-hours stages
- ** Closing pre-market and after-hours, ** prices in the pre-market and after-hours stages are not included in the calculation
c) If you close the pre-market and after-hours, and also close the overnight trading, then only yesterday's closing price and regular trading hours' price will be taken. If there is a company move to split or merge stocks at this time, it may result in the previous closing price not being updated in the pre-market stage, resulting in the asset display still being calculated according to yesterday's closing price. At this time, the pre-market and after-hours prices can be opened, and it will return to normal.
d) If the pre-market and after-hours are open, but the overnight trading is not open: the latest price will be taken as the pre-market and after-hours prices, and the after-hours prices will still be taken during the overnight trading stage.
The daily profit and loss only calculates the actual position data, and the service fees generated by trading are not included in the daily profit and loss. For more detailed instructions, please refer to the Asset Daily P/L Statement.
Cost introduction
Cost: Currently, the system supports two cost price options, namely diluted cost and average opening cost. The default is diluted cost. If you need to change it, you can select it in Portfolio > More > Portfolio Settings > Cost Calculation.
1. Diluted cost
Diluted cost represents your break-even price during the holding period from opening to closing, that is, each time add to or reduce a position during the holding period may amortize or depreciate the cost price. The profit and loss of each trading during the holding period (excluding commissions and fees, etc.) is calculated, taking into account both buying and selling as well as changes in corporate action dividends.
Calculation equations:
- For a long position, Diluted cost = (Total amount purchased during the holding period - Total amount sold during the holding period - Cash dividends during the holding period) / Current number of holdings
- For a short position, Diluted cost = (Total amount sold during the holding period - Total amount purchased during the holding period - Cash dividends during the holding period) / Current number of holdings
**Cost update logic: **Diluted cost that will be updated after the sale.
2. Average opening cost
The average opening cost represents the cost corresponding to the positions held. Only add to positions (excluding commissions and fees, etc.) is considered, and the reduction in positions is not considered. The positions that have been reduced have turned into profit and loss.
**Calculation equation: **Average opening cost = (Average cost before opening position × Volume before opening position + Amount of this opening position) / Volume held after purchase
**Cost update logic: **After the trading is successfully opened (long position opening, short sell opening), the opening cost will be updated, and the average opening cost will not be updated for closing / opening positions.
3. Uniform rules for cost calculation
Both diluted cost and average opening cost apply:
If intraday transactions are made in the same direction, such as liquidating a long position and then opening a new position on the same day, the system will regard it as day trading, and will continue to calculate the cost based on the data during the holding period.
However, if it is a trading in different directions, such as shorting sell - closing positions - going long positions during the day, the cost will be cleared after liquidation, and the calculation will start again when opening a position again.
More detailed instructions can be found in the Cost Calculation Method.
4. Calculation method of rate of return
There are currently two calculation rules for yield:
(1) Simple weighting = Accumulated rate of return = Accumulated income / (Total assets at the beginning of the period + Net inflow during the period)
This method regards all net inflows such as fund deposits and withdrawals, stock switches, etc. in the account within the statistical interval as the last adjustment of the opening assets during the period, and combines them with the opening assets as investment costs.
- Advantages: fast calculation, easy to understand
- Disadvantages: Compared with the other two methods, it is relatively inaccurate, especially when the account funds are transferred out in a large amount or the calculation interval is long, which may lead to distortion and exaggeration of returns, even negative numbers, and loss of reference value
(2) Time-weighted rate of return = [1 (1 + Day's rate of return on the 1st day) (1 + Day's rate of return on the 2nd day)... × (1 + Daily yield on the nth day) - 1] × 100%
Where, Daily rate of return = Daily profit and loss / (Assets at the end of yesterday's date + Net investment of the day)
Net inflow refers to fund deposits and withdrawals and stock switches. This method divides the entire interval into days, first calculating the daily rate of return, and finally calculating the cumulative rate of return of the interval.
- Advantages: The interval is divided into multiple time periods by day, minimizing the impact of net inflow on yield
- Disadvantages: The investment amount is not considered, and the daily rate of return is treated equally. If large amounts (relative to the account net worth) of funds are frequently deposited and withdrawn, it may cause the amount of return to be opposite to the return rate symbol. At this time, the rate of return has no reference value
5. P/L calendar
The P/L calendar calculates the profit and loss by currency and then totals it, so it will not be affected by exchange rate changes, but feedbacks the real profit and loss situation.
First, the profit and loss will be calculated for each currency, then totaled and converted into HKD
Currency A profit and loss = Total assets at the end of the period (T day) - Total assets at the beginning of the period (T - 1 day) - Net investment on that day
Daily P/L = Profit and loss of currency A × Exchange rate of currency A + ...+ Currency N profit and loss × Currency N exchange rate
Note: The profit and loss shown in the income calendar is not equal to the Daily P/L on the Assets page. The reasons are as follows:
- The profit and loss of the P/L calendar is calculated by taking the real-time assets of the day - the total assets at the beginning of the day. Total assets at the beginning of the day = Total cash at 20:00 (ET) + Total holdings market capitalization (this calculation only uses the closing price of US stocks + the closing price of HK stocks)
- 20:00 (ET) corresponds to Beijing time, 8:00 a.m. in summer time and 9:00 a.m. in winter time
- Daily P/L = (Current price × Current quantity) - (Yesterday's closing price × Yesterday's closing quantity) + Selling turnover of the day - Buying turnover of the day. If we look at it separately according to the market, Daily P/L = Profit and loss of HK stocks on that day + Profit and loss of US stocks yesterday + Fund profit and loss
- Among them, the profit and loss of US stocks will be automatically adjusted according to the pre-market and post-market prices opened by customers. For detailed logic, please refer to Daily P/L Statement
Key Takeaways:
- Core functions: accumulated P/L, holdings P/L, daily P/L rate of return analysis (simple weighting / time weighting)
- Calculation logic:
- Accumulated P/L: Total daily profit and loss during the period (USD converted into HKD at the exchange rate)
- Stocks & positions P/L: (Current price - Cost) × Number of positions held (Supporting diluted cost / Average opening cost)
- Daily P/L: Calculated based on the spread between the latest price and yesterday's closing price (covering different trading session of HK stocks / US stocks)
- Notes:
- Exchange rate fluctuations may affect HKD equivalent calculation
- The profit and loss of US stocks are affected by the pre-market, after-hours and overnight trading settings
- When calculating the rate of return, attention should be paid to the impact of net capital inflow on the results
FAQs
Q1: Why did the stock suffer a loss after the day's netting?
After the netting on that day, in fact, according to the latest price, the total market capitalization of current holdings has decreased, but the dividend is paid after the netting. In this case, the cost will not decrease until the dividend is recorded.
Q2: Why did the holdings P/L not match the daily profit and loss?
Holdings P/L is the accumulation calculated from the opening of the position, and it is related to the cost price.
Daily P/L represents the spread between the market capitalization of the stock on that day and the market capitalization of yesterday. The profit and loss of the day is related to the closing price of the stock yesterday.
Q3: Why did I feel that the cost and profit and loss did not match after the stock was sold and shorted again?
After changing the position direction, the profit and loss will be recalculated, which is equivalent to the previous position direction has been closed and will not inherit the cost of long positions.
Q4: Why does the profit and loss ranking not match the cumulative profit and loss of individual stocks?
The different update frequencies of the statistics on both sides will lead to mismatch: The profit and loss ranking is offline data, updated once a day. The profit and loss details of individual stocks are real-time data, updated in real time.
Q5: Why is the total profit and loss not equal to total assets at the end of the period - total assets at the beginning of the period?
Since it is a comprehensive account, the assets at the beginning and end of the period will be converted into HKD for calculation, but the profit and loss amount does not take into account exchange rate changes. For example:
Deposit USD 10,000, the opening exchange rate is 7.8, and after conversion to HKD, the opening assets are HKD 78,000. There is no trading, and the closing assets are still USD 10,000. The ending exchange rate is 7.82, which is converted into HKD 78,200, but the actual profit and loss is 0.
Q6: Why is the profit and loss shown in the income calendar not equal to the daily P/L on the assets page?
The reasons are as follows:
- The profit and loss of the P/L calendar is calculated by taking the real-time assets of the day - the total assets at the beginning of the day. Total assets at the beginning of the day = Total cash at 20:00 (ET) + Total holdings market capitalization (this calculation only uses the closing price of US stocks + the closing price of HK stocks)
- 20:00 (ET) corresponds to Beijing time, 8:00 a.m. in summer time and 9:00 a.m. in winter time
- Daily P/L = (Current price × Current quantity) - (Yesterday's closing price × Yesterday's closing quantity) + Selling turnover of the day - Buying turnover of the day. If we look at it separately according to the market, Daily P/L = Profit and loss of HK stocks on that day + Profit and loss of US stocks yesterday + Fund profit and loss
- Among them, the profit and loss of US stocks will be automatically adjusted according to the pre-market and after-hours prices opened by customers. For detailed logic, please refer to Daily P/L Statement
Disclosure
This article is for reference only and does not constitute any investment advice.
- Contact Us
- WhatsApp Chat (for general enquiries):+65 6330 3033
- Trading days: 9:00am – 6:00pm (GMT+8)
- Dealing Hotline:+65 6330 3030
- Trading days: 9:00am – 6:00pm (GMT+8)
- For Institutions
- Corporate Services
- OpenAPI
- contact@longbridge.sg
- About
- About us

Registered with the Monetary Authority of Singapore (MAS), Long Bridge Securities Pte. Ltd. is a Capital Markets Services Licence holder and Exempt Financial Adviser (Licence No. CMS101211).

A licensed corporation recognized by the SFC (CE No. BPX066). Holder of License Types 1 (Dealing in Securities), 4 (Advising on Securities) and 9 (Asset Management). Also a registered HKEX participant and HKSCC participant.
 Long Bridge Securities LLC
A broker dealer registered with the Securities and Exchange Commission (SEC)(CRD: 314519/SEC: 8-70711), a member of the Financial Industry Regulatory Authority (FINRA) and Securities Investor Protection Corporation (SIPC).

A New Zealand registered Financial Service Provider (FSP number: FSP600050), and is a member of the Financial Dispute Resolution Scheme, a New Zealand independent dispute resolution service provider.
Long Bridge Securities Pte. Ltd. (“Long Bridge Securities”) (UEN No.: 202111825D) is regulated by the Monetary Authority of Singapore and holds a Capital Markets Services Licence for dealing in capital markets products that are securities, collective investment schemes, and exchange-traded derivatives contracts, and is an Exempt Financial Adviser.
The information contained on this website is provided for general information and educational purposes only. It does not take into account your specific investment objectives, financial situation, or particular needs. The content on this website does not constitute financial advice, an investment recommendation, an offer, or a solicitation to buy or sell any financial product.
You should carefully consider the suitability of any investment in light of your own circumstances, including your investment objectives, financial situation, and risk tolerance. Where necessary, you should seek advice from an independent financial adviser under a separate engagement before making any investment decision.
All investments carry risks. The value of financial instruments and products may rise or fall, and you may lose all or more than your initial investment. Past performance is not necessarily indicative of future results. Certain products, such as margin trading, options, warrants, exchange-traded derivatives, and structured products, involve a high degree of risk and may not be suitable for you.
Before trading, you must read the relevant risk disclosure statements available on the Longbridge Risk Disclosure Statement page.
While Long Bridge Securities takes reasonable care to ensure that the information provided on this website is accurate as at the time of publication, no representation or warranty is made as to its accuracy, adequacy, completeness, or reliability. Information may be subject to change without notice. Long Bridge Securities shall not be liable for any loss or damage arising from any reliance on or use of the information contained on this website.
This advertisement has not been reviewed by the Monetary Authority of Singapore.
In the event of any discrepancy or inconsistency between the English version and the Chinese translation, the English version shall prevail.